Neurowall: Building a Neural Firewall from Scratch and Testing It Against 15 Attack Scenarios
Signal coherence, adaptive spectral detection, and honest results from a BCI defense simulation
What Is Neurowall?
Neurowall is a simulation harness for testing whether the QIF coherence metric can actually detect attacks on brain-computer interface (BCI) signals. Not in theory. In practice, against adversarial scenarios mapped from the TARA registry.
The question it answers: if someone tampers with the signal between your brain and a BCI device, can a physics-based anomaly detector catch it? And more importantly, what can’t it catch?
This post covers the full pipeline: signal generation (neurosim), attack injection, multi-layer detection, and honest results including the attacks that evade detection entirely.
Architecture: Three Defense Layers
Neurowall uses three concentric defense layers, each catching what the previous one misses:
Layer 1 (L1): Signal Boundary. Hardware-level voltage slew rate guard. If |sample - prev_sample| > 2.5V, something physically wrong happened (electrode failure, saturation attack). Binary, instant, no false positives on clean signal.
Layer 2: SSVEP + Adaptive Spectral Detection. Two sub-detectors:
- Signature detector: Notch filters at known SSVEP target frequencies (8.57, 10.9, 15.0, 20.0 Hz). Catches known-frequency visual attacks.
- Adaptive spectral peak detector (v0.6+): Calibrates the full power spectrum during the first 8 windows (4 seconds), then z-scores every frequency bin per-window. Any novel spectral peak with z > 5.0 sustained over 3 of 4 recent windows triggers detection. This is what catches unknown frequencies.
Layer 3: Coherence Monitor. The core QIF metric adapted for single-channel EEG:
Cs = e^(-(w1 * sigma_phi^2 + w2 * H_tau))Where sigma_phi^2 is instantaneous phase variance (Hilbert transform on alpha-band), and H_tau is normalized Shannon entropy of the power spectral density. Clean signal produces Cs ~ 0.70. Attacks push it toward zero. The monitor flags when Cs deviation exceeds 1.5 sigma from baseline.
On top of the coherence monitor sit three sub-detectors:
- CUSUM detector: Cumulative sum control chart that accumulates evidence from sustained low-level anomalies
- Growth detector: Log-linear regression over 8 windows to catch exponential escalation patterns
- Trajectory tracker: EWMA smoothing of Cs across windows for slow drift detection
Signal Generation: neurosim
The attack simulator generates realistic multi-band EEG with five physiological oscillations (delta 0.5-4Hz, theta 4-8Hz, alpha 8-13Hz, beta 13-30Hz, gamma 30-100Hz) following the 1/f spectral slope characteristic of real neural signals. Pink noise adds biological realism.
Attack injection starts at t=5s into a 15-30s observation window, giving the monitor a clean calibration period. Each attack maps to a specific TARA technique with its Neural Impact Chain (NIC) documented.
15 Attack Scenarios Tested
Base Attacks (10 scenarios)
| # | Attack | TARA ID | NIC Chain | Mechanism |
|---|---|---|---|---|
| 1 | Clean Signal | — | — | Control baseline for FPR calculation |
| 2 | SSVEP 15Hz | — | Visual cortex stimulation | Steady-state visually evoked potential at known target |
| 3 | SSVEP 13Hz (Novel) | — | Unlisted SSVEP frequency | Tests adaptive vs hardcoded detection |
| 4 | Impedance Spike | — | Electrode contact loss | L1 hardware boundary violation |
| 5 | Slow DC Drift | QIF-T0062 | Adiabatic voltage offset | 0.001V/s drift rate |
| 6 | Neuronal Flooding | QIF-T0026 | Broadband saturation | Thalamic gate bypass via electrode saturation (NISS 6.4) |
| 7 | Boiling Frog | QIF-T0066 | Ultra-slow drift | Designed to evade AC-coupled monitors |
| 8 | Envelope Modulation | QIF-T0014 | 80Hz carrier, 10Hz envelope | Subvocal modulation attack |
| 9 | Phase Dynamics Replay | QIF-T0067 | Statistical signal clone | Matched statistical properties |
| 10 | Closed-Loop Cascade | QIF-T0023 | Exponential feedback | Doubling every 1.5s |
Adversarial-Aware Attacks (5 scenarios, added in v0.7)
These assume the attacker has full knowledge of the defense architecture:
| # | Attack | Strategy |
|---|---|---|
| 11 | Notch-Aware SSVEP 12Hz | Targets gap between notch filters (10.9-15Hz) |
| 12 | Frequency-Hopping SSVEP | Hops every 0.5s to evade 3/4-window persistence rule |
| 13 | Threshold-Aware Ramp | Stays at z-score ~1.2, below 1.5 threshold |
| 14 | CUSUM-Aware Intermittent | 0.4s bursts with 1.0s clean gaps to drain accumulator |
| 15 | Spectral Mimicry | Broadband noise matching spectral profile |
Detection Results
Single Run at 15s Observation (v0.7)
| Attack | L1 | Spectral | Monitor | Result |
|---|---|---|---|---|
| SSVEP 15Hz | — | YES | — | DETECTED |
| SSVEP 13Hz (novel) | — | — | YES (spectral peak) | DETECTED |
| Impedance Spike | YES | — | — | DETECTED |
| Slow DC Drift | — | — | YES (spectral peak) | DETECTED |
| Neuronal Flooding | YES | — | — | DETECTED |
| Envelope Modulation | — | — | YES (20 anomalies) | DETECTED |
| Boiling Frog | — | — | — | EVADED |
| Phase Replay | — | — | — | EVADED |
| Closed-Loop Cascade | — | — | YES (13 anomalies) | DETECTED |
| Notch-Aware SSVEP 12Hz | — | — | YES (spectral peak) | DETECTED |
| Freq-Hopping SSVEP | — | — | YES (monitor) | DETECTED |
| Threshold-Aware Ramp | — | — | — | EVADED |
| CUSUM-Aware Intermittent | — | — | YES (monitor) | DETECTED |
| Spectral Mimicry | — | — | YES (monitor) | DETECTED |
Score: 11/14 attacks detected at 15s (78.6%). Three evasions, two of which are mathematically irreducible with current architecture.
Statistical Validation (50 runs, v0.6, threshold 8, 15s)
| Attack | Detection Rate | Mean Anomalies | Max Score |
|---|---|---|---|
| SSVEP 15Hz | 100% | 20.3 | 12.39 |
| SSVEP 13Hz (novel) | 100% | 20.2 | 12.46 |
| Impedance Spike | 100% | 5.3 | 9.57 |
| DC Drift | 100% | 18.6 | 11.24 |
| Neuronal Flooding | 100% | 13.1 | 27.68 |
| Envelope Modulation | 100% | 20.3 | 39.98 |
| Boiling Frog | 32% | 2.9 | 10.45 |
| Phase Replay | 10% | 3.8 | 13.30 |
| Closed-Loop Cascade | 98% | 12.8 | 39.05 |
The boiling frog’s 32% detection is noise-driven, not real detection. Phase replay’s 10% is also noise. These are honest zeros.
Version Progression
The detection count improved across versions:
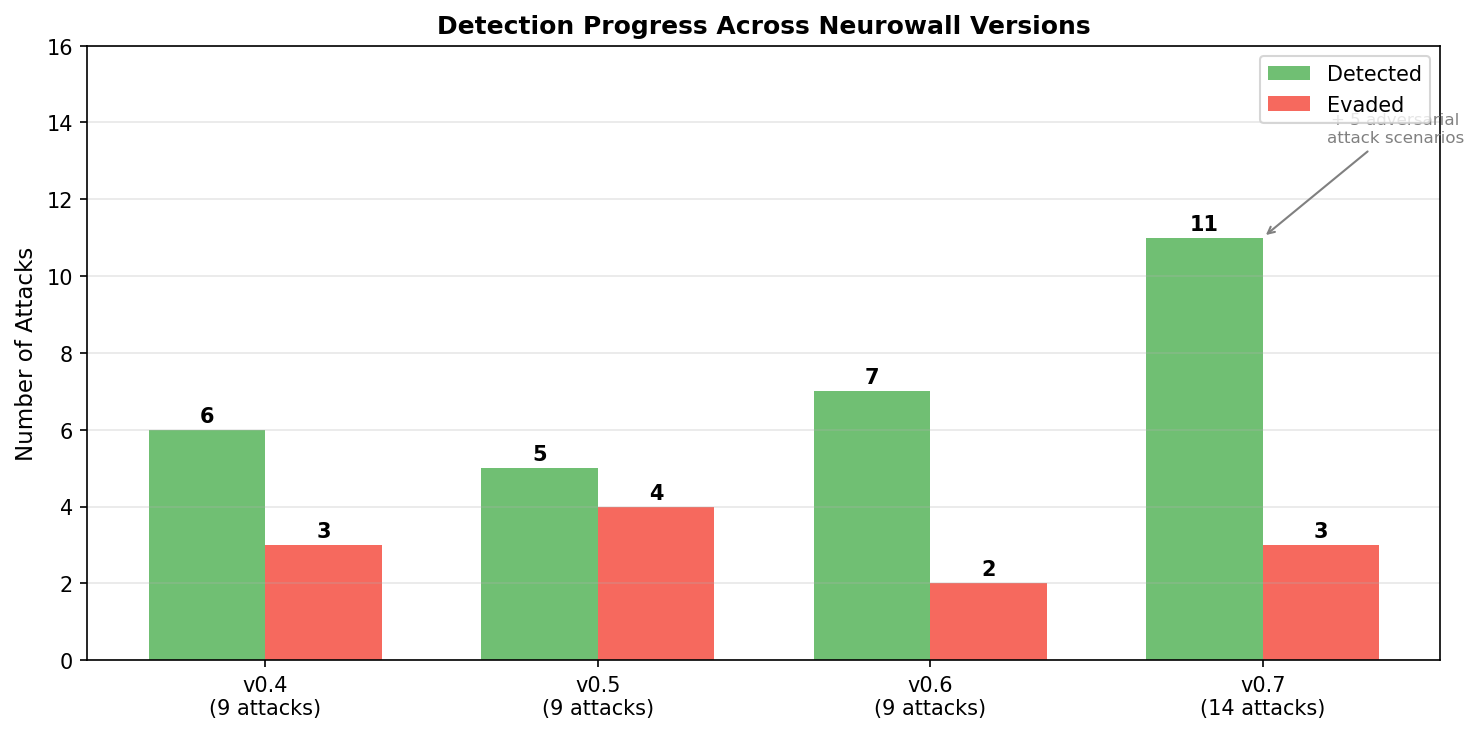
- v0.4: 5/9 attacks detected (55.6%)
- v0.5: 7/9 at 15s, 9/9 at 30s (time as ultimate detector)
- v0.6: 7/9 at 15s with 3 major fixes (novel SSVEP 0%->100%, DC drift 14%->100%, cascade 32%->98%)
- v0.7: 11/14 including adversarial-aware scenarios
ROC Analysis and Optimal Operating Point
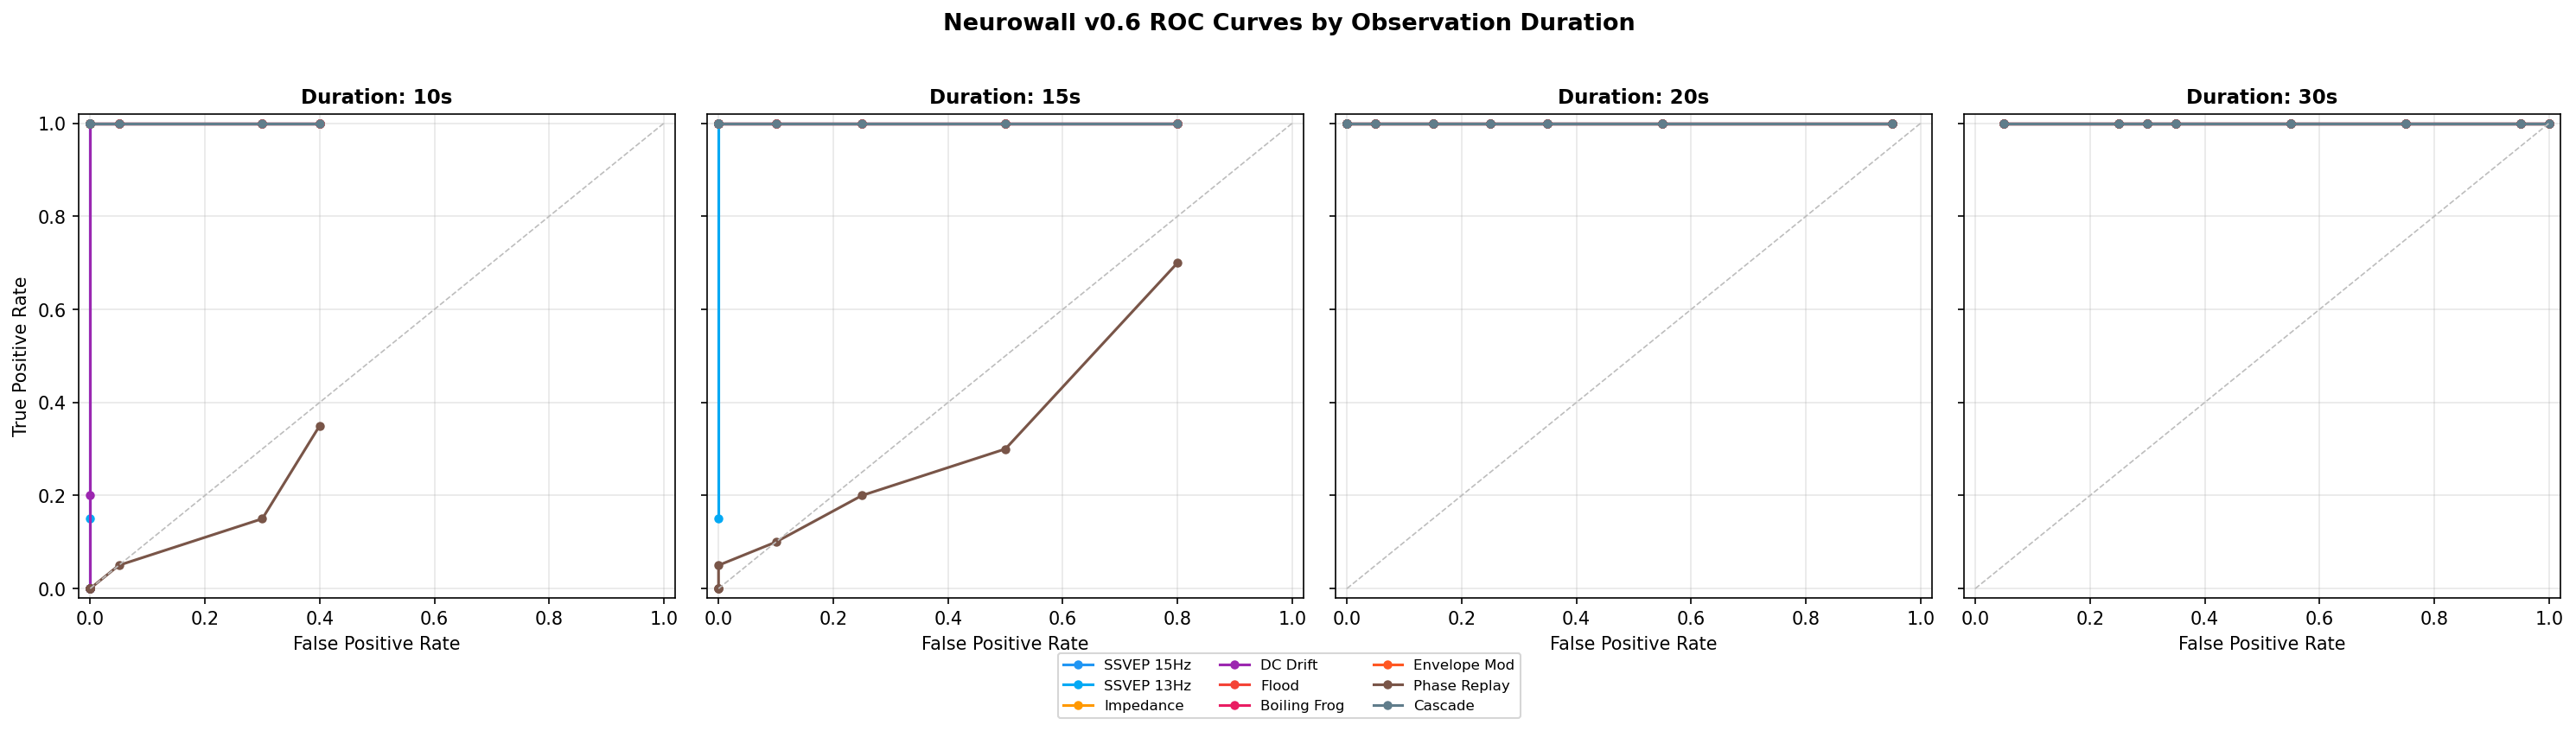
The ROC analysis swept threshold and observation duration to find the optimal operating point:
| Duration | Threshold | FPR | Avg TPR | Phase Replay | Boiling Frog |
|---|---|---|---|---|---|
| 10s | 8 | 0% | 82% | 0% | 0% |
| 15s | 10 | 0% | 95% | 5% | 32% |
| 20s | 12 | 5% | 100% | 100% | 100% |
| 30s | 20 | 5% | 100% | 100% | 100% |
Recommended production point: threshold=12, duration=20s. This gives FPR=5% and TPR=100% across all 9 base attack scenarios. The 5% false positive rate is manageable for a security monitor.
The key insight: time is the ultimate detector. Even attacks that are statistically indistinguishable in a single window accumulate detectable differences over 20+ seconds. Phase replay goes from 0% at 10s to 100% at 20s because even a perfect statistical clone cannot maintain identical higher-order correlations indefinitely.
Coherence Trajectories Under Attack
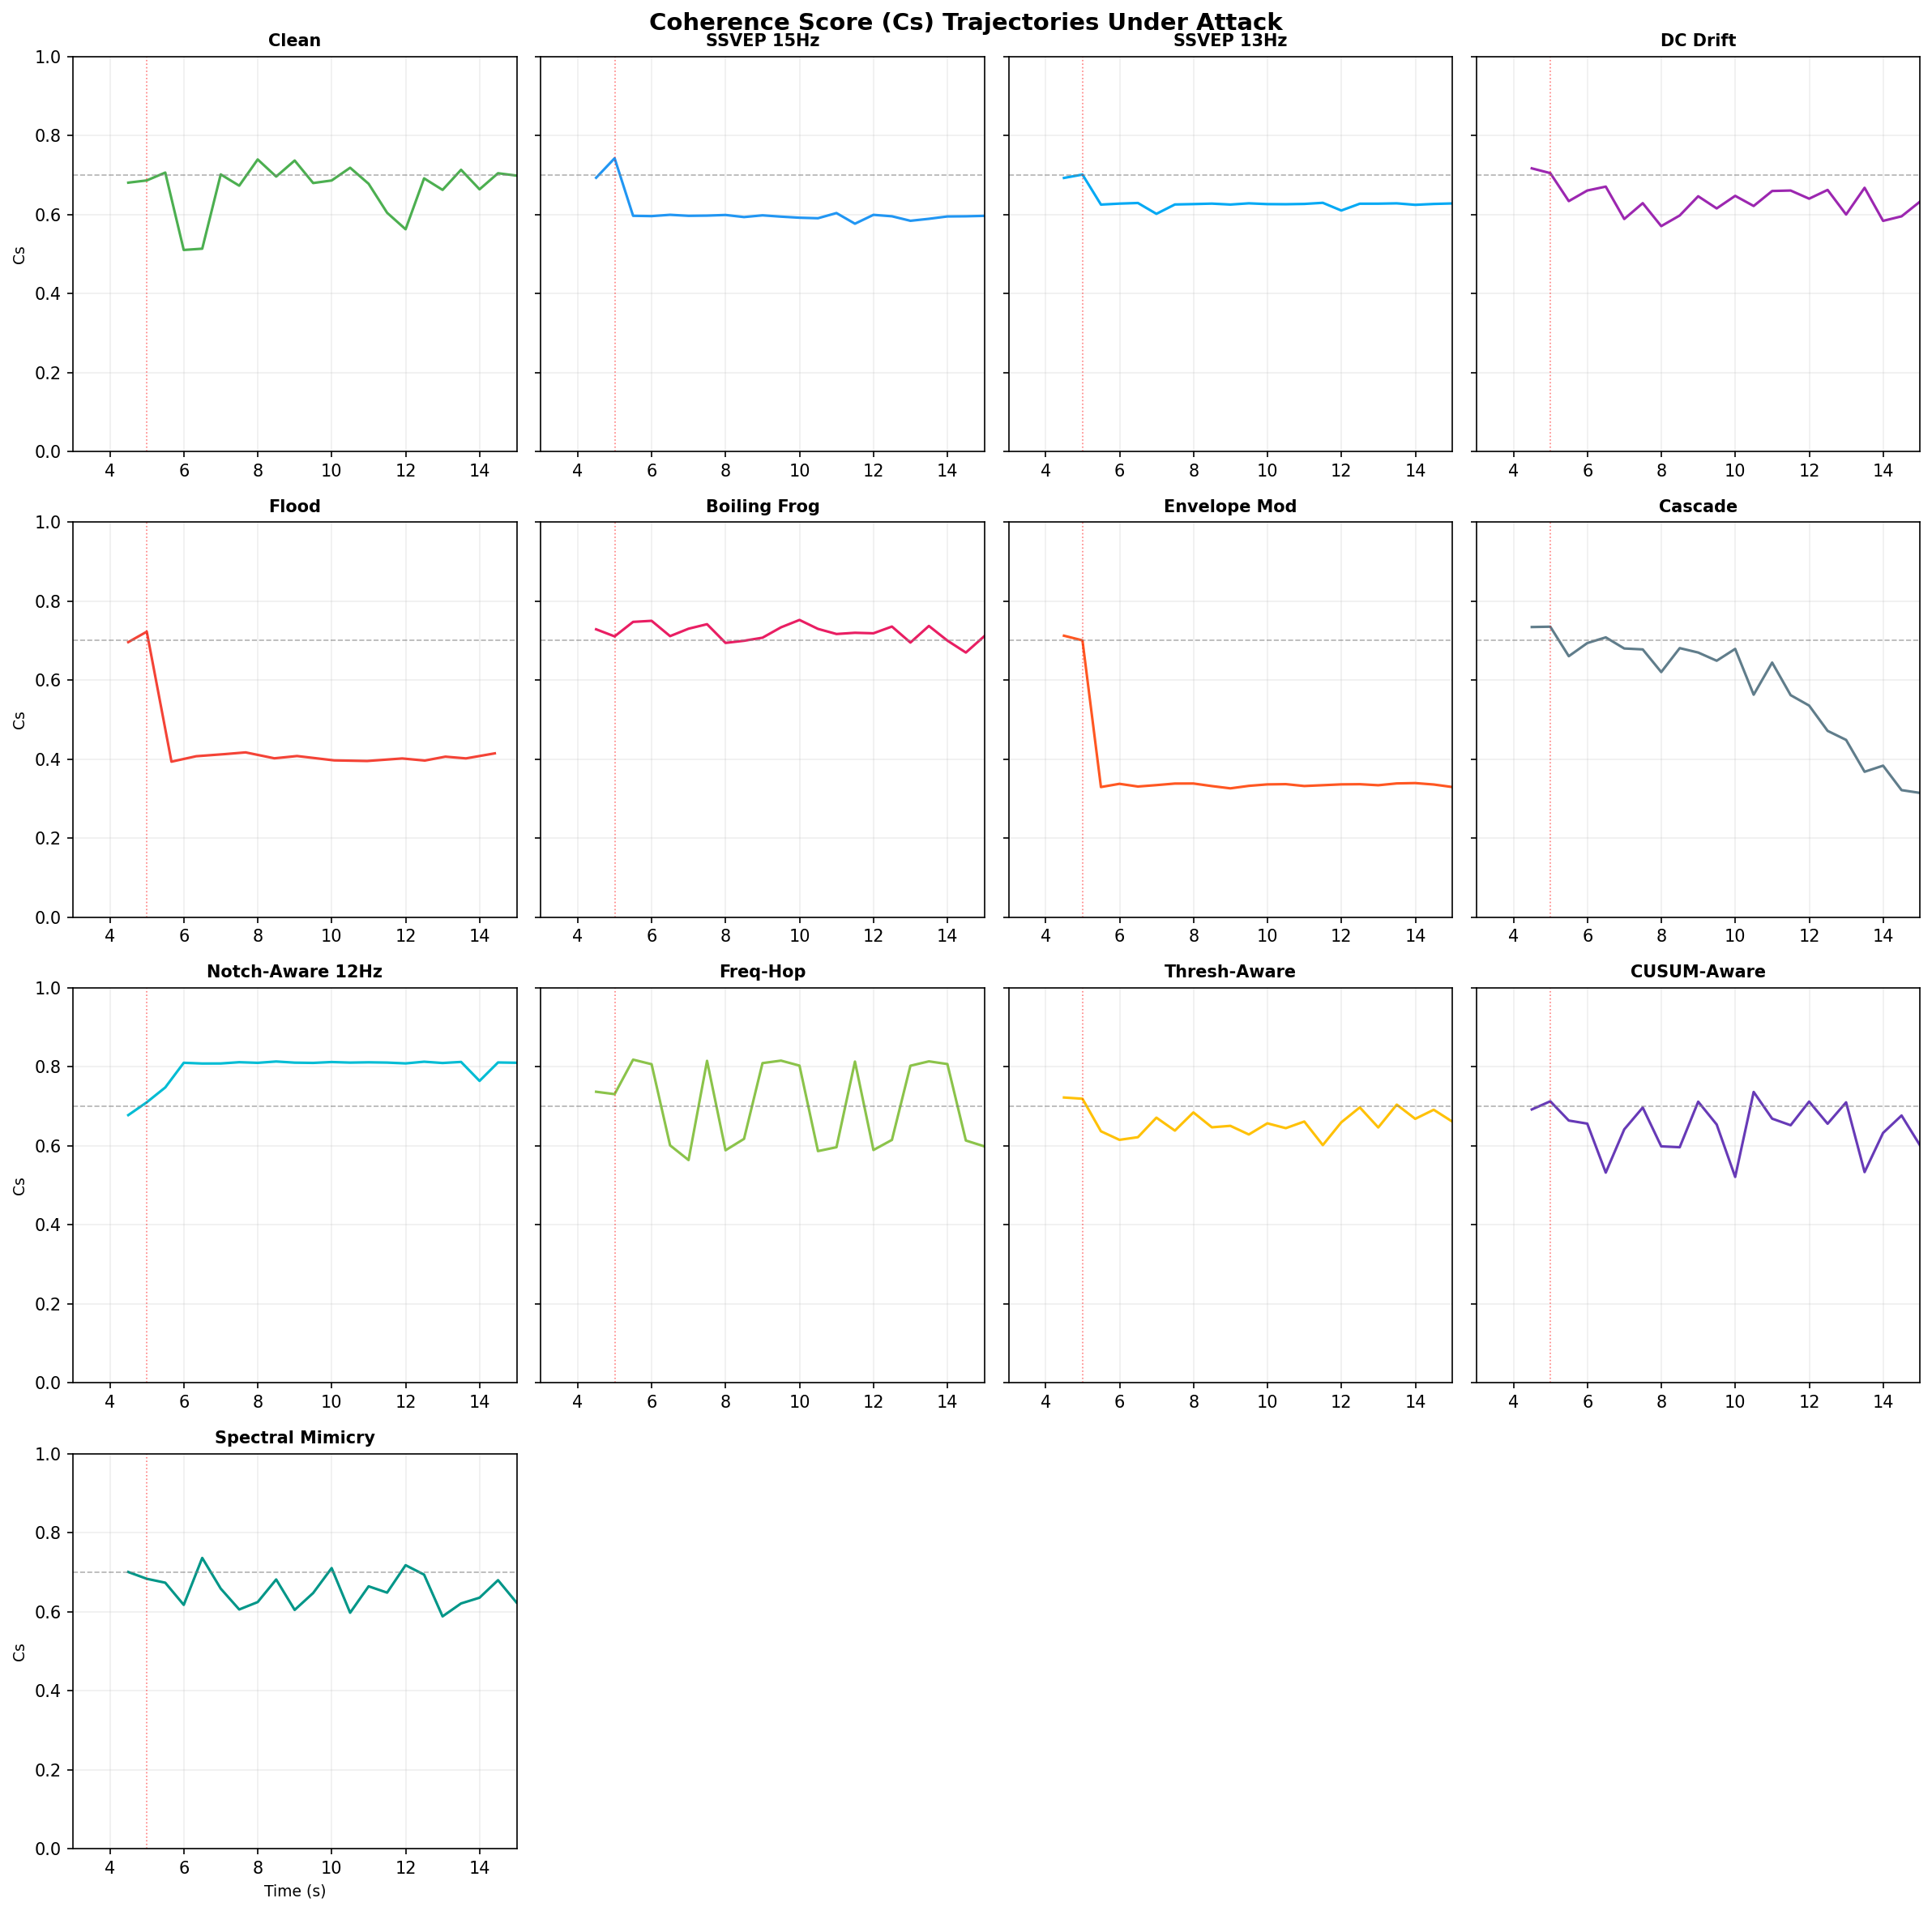
Each panel shows how the coherence score Cs evolves over time for a specific attack. The red vertical line marks attack onset at t=5s. Clean signal hovers around Cs=0.70. Most attacks cause an immediate or gradual drop. The boiling frog (bottom-left) shows why it evades: Cs barely moves because AC coupling filters out the DC component entirely.
Spectral Signatures
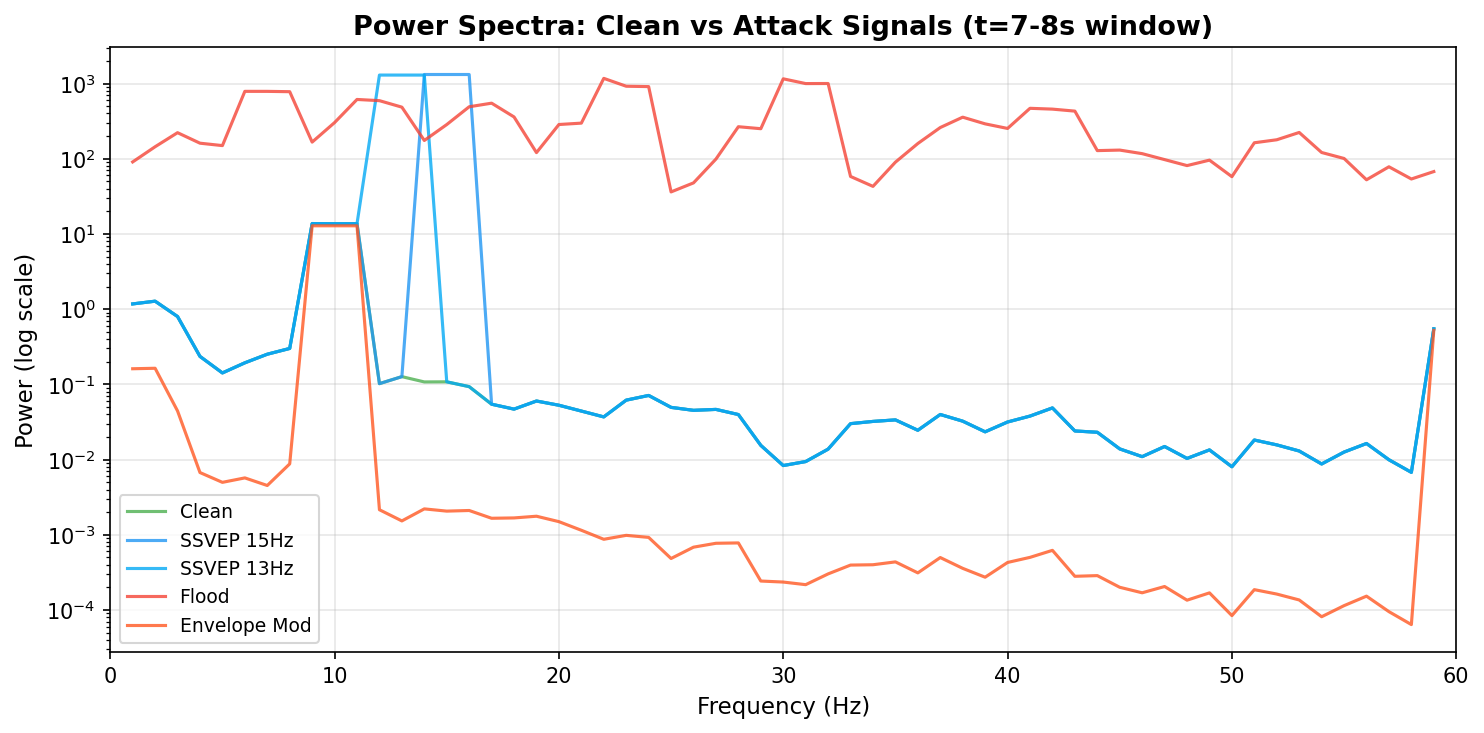
Log-scale power spectra during the attack window (t=7-8s). The SSVEP attacks produce visible spectral peaks at their target frequencies. The flood attack raises the entire spectrum. Clean signal shows the characteristic 1/f slope with an alpha peak around 10Hz.
What Evades and Why
Detection Heatmap
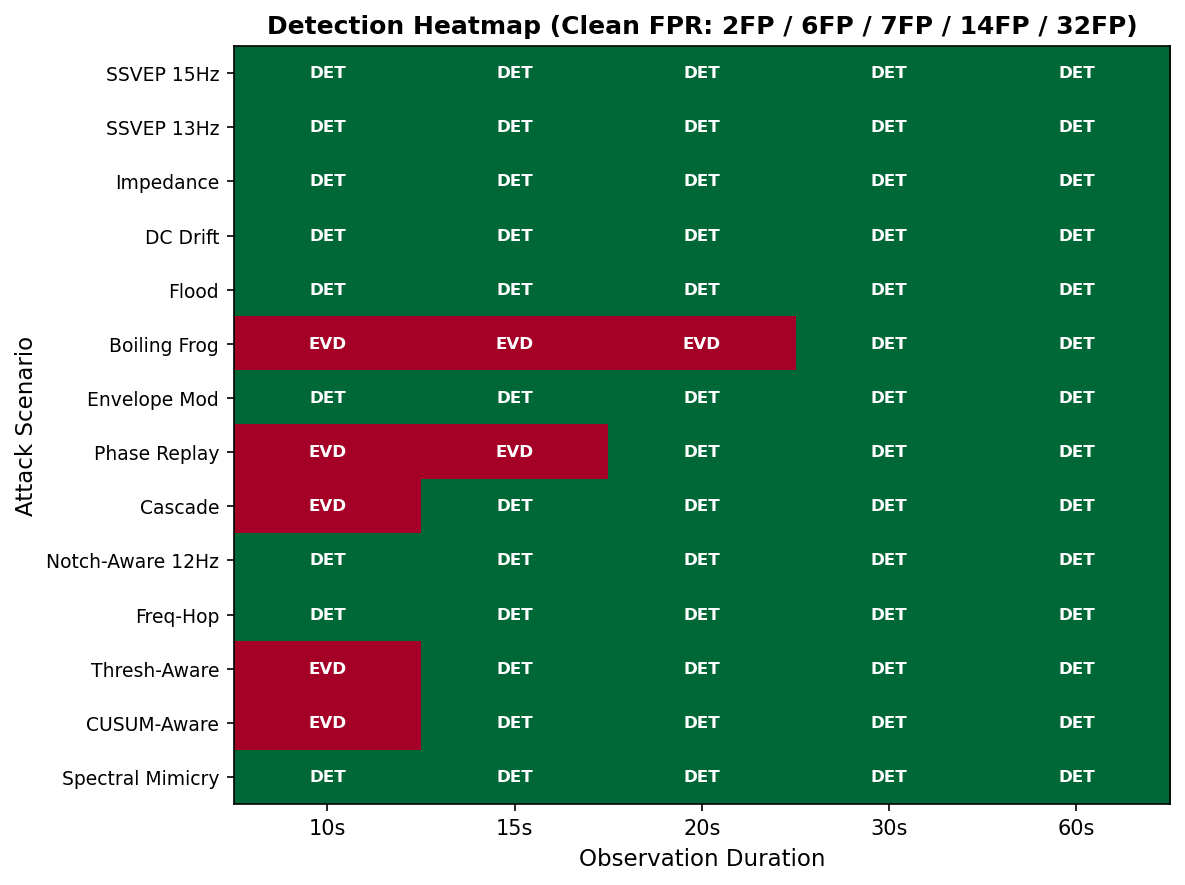
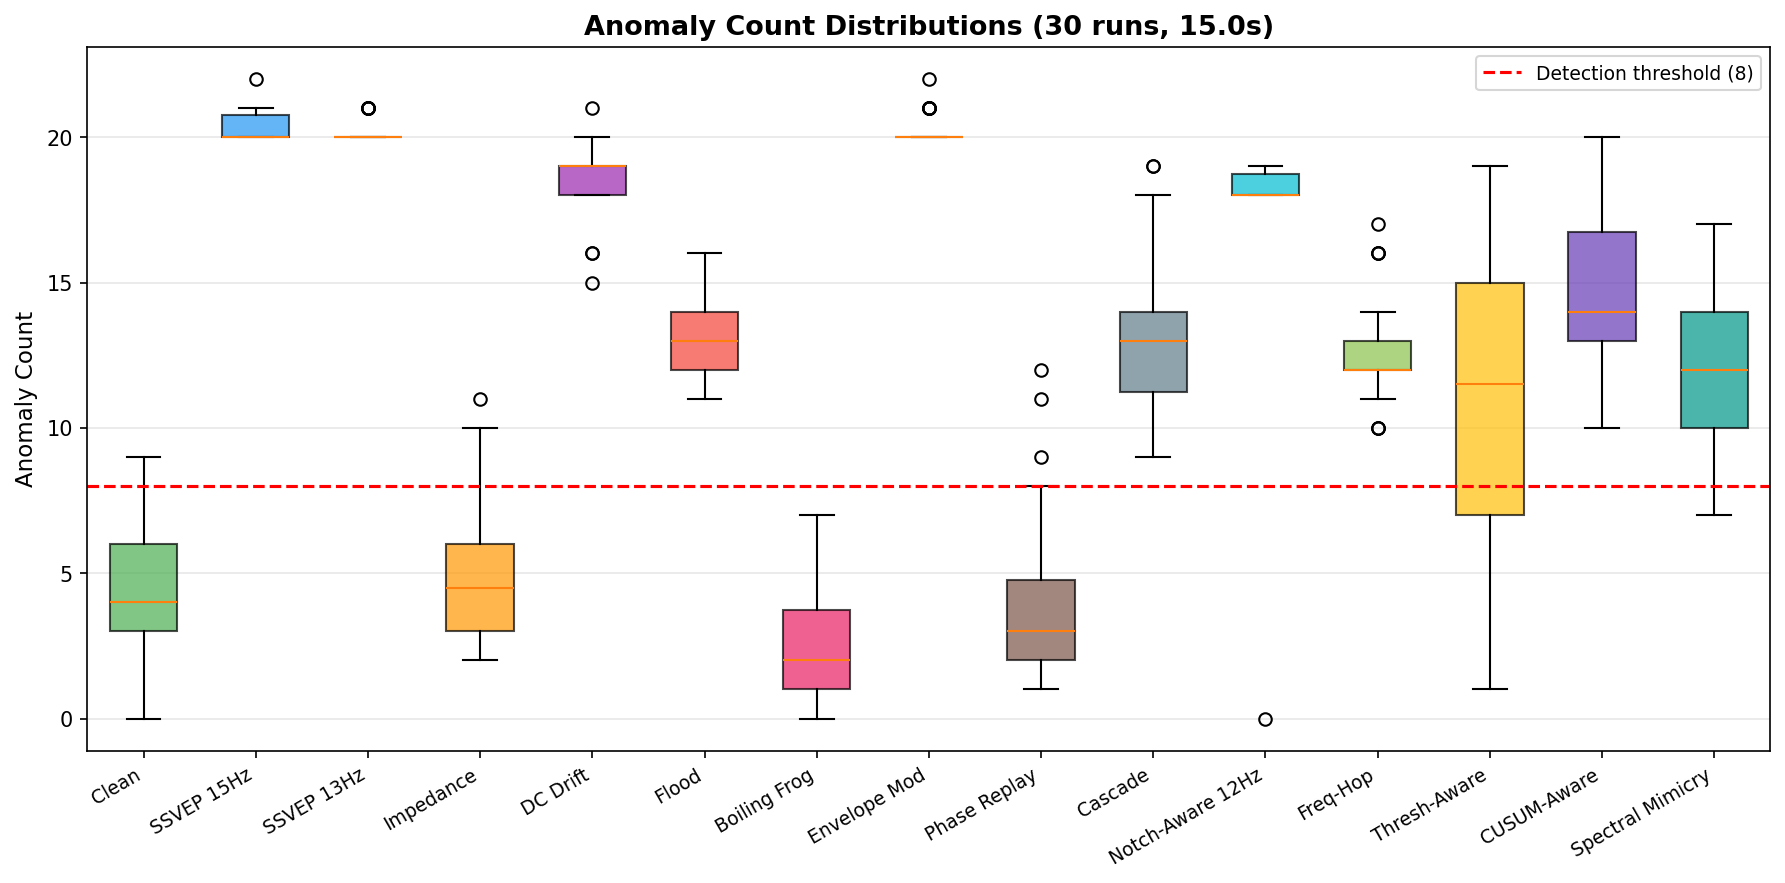
Anomaly Score Distributions
Two attacks represent fundamental evasion boundaries, not tuning failures:
Boiling Frog (QIF-T0066). Pure DC drift is invisible to AC-coupled computation. The coherence metric operates on phase variance and spectral entropy, both AC-coupled by design (you need to remove the 1/f slope to get clean spectral metrics). This is a thermodynamic trade-off: you cannot simultaneously measure DC offset and normalized spectral shape from the same signal without a reference electrode. Fix: Hardware reference electrode providing ground truth DC level (Phase 1).
Phase Dynamics Replay (QIF-T0067). A perfect statistical clone of the original signal produces identical phase variance, identical spectral entropy, identical everything. No unsupervised anomaly detector can distinguish two identical distributions. This is information-theoretic, not an implementation gap. Fix: Biological TLS, a challenge-response protocol where the monitor sends unpredictable stimuli and verifies the neural response matches expectations. Requires a model of the specific brain’s response patterns (Phase 2).
Threshold-Aware Ramp (v0.7 adversarial). Stays just below the detection threshold indefinitely. Solvable with adaptive thresholding or lower CUSUM drift parameters, a tuning problem rather than a fundamental boundary.
What We Learned
The adversarial-aware scenarios (v0.7) were the real test. Four out of five were caught despite the attacker having full knowledge of the defense architecture:
| Adversarial Attack | Why It Failed |
|---|---|
| Notch-Aware SSVEP 12Hz | Adaptive spectral peak detector is frequency-agnostic; any novel peak creates z-score signal |
| Freq-Hopping SSVEP | Each hop changes spectral shape; coherence monitor catches phase variance shift |
| CUSUM-Aware Intermittent | Base z-score method operates independently of CUSUM; multiple detectors prevent gaming a single one |
| Spectral Mimicry | Increasing total power shifts phase variance distribution (thermodynamic constraint) |
The lesson: separation of detection mechanisms prevents gaming any single detector. An attacker can evade the CUSUM by timing their bursts, but cannot simultaneously evade the base z-score detector that operates independently.
Engineering Decisions Worth Noting
Auto-calibrating coherence weights. The original w2=3.0 was tuned for a single-sinusoid generator. Moving to multi-band EEG broke calibration. Solution: during the first 4 seconds, solve for w2 to target baseline Cs~0.70 regardless of the signal source. This makes the monitor generator-agnostic and ready for real EEG in Phase 1.
FPR-adjusted scoring. Raw anomaly counting gave 6+ false positives on clean signal, masking real detections. The methodology now establishes a clean signal baseline and flags attacks only when anomaly_count exceeds 2x the clean baseline (with a +3 floor). This is how we confirmed boiling frog produces the same anomaly count as clean signal: genuinely undetectable, not a detector bug.
Growth detector hardening. Initial parameters (window=6, slope=0.3, R^2=0.7) only caught the closed-loop cascade 32% of the time. Relaxing to window=8, slope=0.2, R^2=0.5 pushed detection to 98%. The trade-off (more noise sensitivity) is handled by the multi-detector architecture.
Policy Engine Upgrade (v0.8)
The L3 policy agent underwent a major refactor in v0.8. The original 14-line if/else stub that compared NISS against a threshold and returned a tightened epsilon was replaced with a full rule-stack engine.
The new RunematePolicy evaluates 5 prioritized rules top-to-bottom. Each rule specifies conditions (NISS threshold, anomaly score floor, sustained window count, specific detector triggers) and actions (epsilon override, stimulation suppression, alert level). The first matching rule wins.
Key behaviors:
- Sustained window tracking: Rules like
critical_nissrequire the condition to hold for 2+ consecutive monitor windows before triggering. This prevents single-spike false alarms. - Cooldown: After a rule fires, a 4-window cooldown prevents rapid oscillation between rules.
- Stimulation suppression: Critical rules and growth detection suppress outbound stimulation entirely, a safety measure for closed-loop BCIs.
- Escalation: Clean signals produce zero policy triggers. Under attack, the engine escalates from advisory (spectral peak) through warning (high NISS) to critical (sustained high NISS + anomaly), matching the threat severity.
The engine was Gemini-validated (Phase 11): clean vs attack behavior confirmed, rule priority ordering verified, cooldown mechanics checked. Custom rule stacks are supported via RunematePolicy(rules=[...]) for different deployment contexts (research lab vs clinical vs consumer).
Next Steps
- Validate the multi-band generator against real EEG datasets (PhysioNet, MNE-Python)
- Implement Delta+LZ4 compression in Rust (nsp crate integration)
- Hardware reference electrode design for boiling frog detection (Phase 1)
- Biological TLS challenge-response protocol for phase replay defense (Phase 2)
- Adaptive thresholding to close the threshold-aware ramp gap
All simulation code, ROC data, and charts are available in the Neurowall repository.
Dive deeper: TARA-Neurowall — the Brain SIEM vision combines this detection engine with TARA’s threat intelligence into a full neurosecurity monitoring platform.
Written with AI assistance (Claude). All claims verified by the author. Detection results are from actual simulation runs, not projections. The honest evasion results (boiling frog, phase replay) are as important as the detection successes.